| Jpopl {fmsb} | R Documentation |
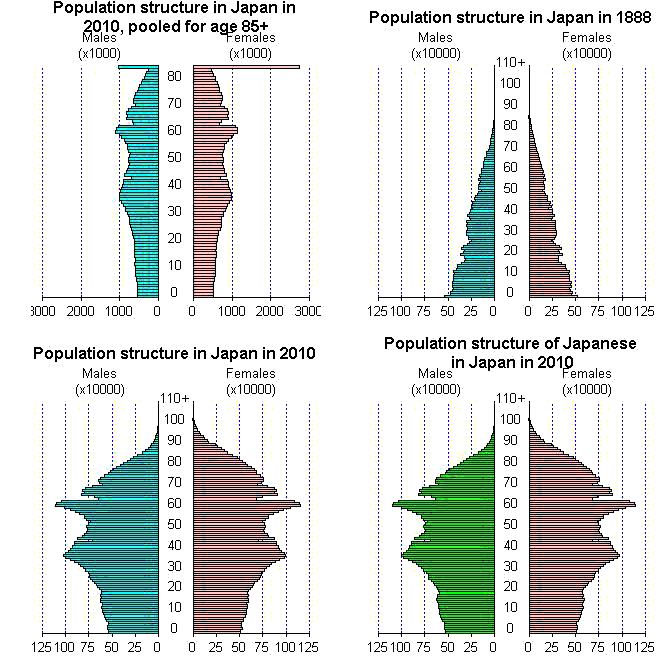
日本でこれまで行われて結果が公開されているすべてのセンサス(国勢調査)の 性・年齢各歳別人口をまとめたデータフレームである。Jpopが85歳以上を1つの カテゴリにまとめていたのに対して109歳までは各歳ごと表示し,110歳以上だけを まとめたものである。また,2000年以降は日本人だけのデータも含めた。
The data gives the sex and age specific population for the all census results in Japan. Jpop is given for population aged 85 or over as a single age-class, but Jpopl separately gives the populations aged less than 110. In addition, since 2000, the data for Japanese in Japan are included.
Jpopl
オブザーベーション数が111あり,67変数のデータフレームである。
A data frame with 111 observations on 67 variables.
列 |
変数名 |
型 |
説明 |
|---|---|---|---|
|
|
| 111水準の要因型 | 年齢(歳,ただし110歳以上は合計) |
|
|
| 数値型 | 1888年国勢調査の男性の年齢各歳別人口 |
|
|
| 数値型 | 1888年国勢調査の女性の年齢各歳別人口 |
|
|
| 数値型 | Age specific population of males in 1893 |
|
|
| 数値型 | Age specific population of females in 1893 |
|
|
| 数値型 | Age specific population of males in 1898 |
|
|
| 数値型 | Age specific population of females in 1898 |
|
|
| 数値型 | Age specific population of males in 1903 |
|
|
| 数値型 | Age specific population of females in 1903 |
|
|
| 数値型 | Age specific population of males in 1908 |
|
|
| 数値型 | Age specific population of females in 1908 |
|
|
| 数値型 | Age specific population of males in 1913 |
|
|
| 数値型 | Age specific population of females in 1913 |
|
|
| 数値型 | Age specific population of males in 1918 |
|
|
| 数値型 | Age specific population of females in 1918 |
|
|
| 数値型 | Age specific population of males in 1920 |
|
|
| 数値型 | Age specific population of females in 1920 |
|
|
| 数値型 | Age specific population of males in 1925 |
|
|
| 数値型 | Age specific population of females in 1925 |
|
|
| 数値型 | Age specific population of males in 1930 |
|
|
| 数値型 | Age specific population of females in 1930 |
|
|
| 数値型 | Age specific population of males in 1935 |
|
|
| 数値型 | Age specific population of females in 1935 |
|
|
| 数値型 | Age specific population of males in 1940 |
|
|
| 数値型 | Age specific population of females in 1940 |
|
|
| 数値型 | Age specific population of males in 1947 |
|
|
| 数値型 | Age specific population of females in 1947 |
|
|
| 数値型 | Age specific population of males in 1950 |
|
|
| 数値型 | Age specific population of females in 1950 |
|
|
| 数値型 | Age specific population of males in 1955 |
|
|
| 数値型 | Age specific population of females in 1955 |
|
|
| 数値型 | Age specific population of males in 1960 |
|
|
| 数値型 | Age specific population of females in 1960 |
|
|
| 数値型 | Age specific population of males in 1965 |
|
|
| 数値型 | Age specific population of females in 1965 |
|
|
| 数値型 | Age specific population of males in 1970 |
|
|
| 数値型 | Age specific population of females in 1970 |
|
|
| 数値型 | Age specific population of males in 1975 |
|
|
| 数値型 | Age specific population of females in 1975 |
|
|
| 数値型 | Age specific population of males in 1980 |
|
|
| 数値型 | Age specific population of females in 1980 |
|
|
| 数値型 | Age specific population of males in 1985 |
|
|
| 数値型 | Age specific population of females in 1985 |
|
|
| 数値型 | Age specific population of males in 1990 |
|
|
| 数値型 | Age specific population of females in 1990 |
|
|
| 数値型 | Age specific population of males in 1995 |
|
|
| 数値型 | Age specific population of females in 1995 |
|
|
| 数値型 | Age specific population of males in 2000 |
|
|
| 数値型 | Age specific population of females in 2000 |
|
|
| 数値型 | Age specific population of Japanese males in 2000 |
|
|
| 数値型 | Age specific population of Japanese females in 2000 |
|
|
| 数値型 | Age specific population of males in 2005 |
|
|
| 数値型 | Age specific population of females in 2005 |
|
|
| 数値型 | Age specific population of Japanese males in 2005 |
|
|
| 数値型 | Age specific population of Japanese females in 2005 |
|
|
| 数値型 | Age specific population of males in 2010 |
|
|
| 数値型 | Age specific population of females in 2010 |
|
|
| 数値型 | Age specific population of Japanese males in 2010 |
|
|
| 数値型 | Age specific population of Japanese females in 2010 |
|
|
| 数値型 | Age specific population of males in 2015 |
|
|
| 数値型 | Age specific population of females in 2015 |
|
|
| 数値型 | Age specific population of Japanese males in 2015 |
|
|
| 数値型 | Age specific population of Japanese females in 2015 |
|
|
| 数値型 | Age specific population of males in 2020 |
|
|
| 数値型 | Age specific population of females in 2020 |
|
|
| 数値型 | Age specific population of Japanese males in 2020 |
|
|
| 数値型 | Age specific population of Japanese females in 2020 |
Japanese population data by sex and age, compiled from the publications (including web) given as national official census record.
Age: Ages, combined for 110+.
M1888-M2020: Age specific number of males' population in Japan for 1888-2020.
F1888-F2020: Age specific number of females' population in Japan for 1888-2020.
M2000J-M2020J: Age specific number of Japanese males' population in Japan for 2000-2020.
F2000J-F2020J: Age specific number of Japanese females' population in Japan for 2000-2020.
下記を実行するためには,pyramidパッケージもインストールしておく必要がある。CRANからinstall.packages("pyramid")でインストール可能。
To execute the example code shown below, it is necessary to install the pyramid package in advance. Installing the pyramid package is done by usual process, install.packages("pyramid") from CRAN.
JlifeとJfertの最近のデータを用いて(つまり,それが今後変わらないとして)Jpopl$M2010とJpopl$F2010から今後100年間の人口予測を行い,1秒おきに人口ピラミッドを書き換えていくデモンストレーションを行うコードをprojection.Rに示した。出生だけとか死亡だけを変えることの影響を調べることが簡単にできる。
Using recent data of Jlife and Jfert (i.e., assuming those values may continue), projecting the population pyramids for the next 100 years based on the Jpopl$M2010 and Jpopl$F2010 can be done by the code projection.R. It may be convenient to assess the effects by either of fertility or mortality.
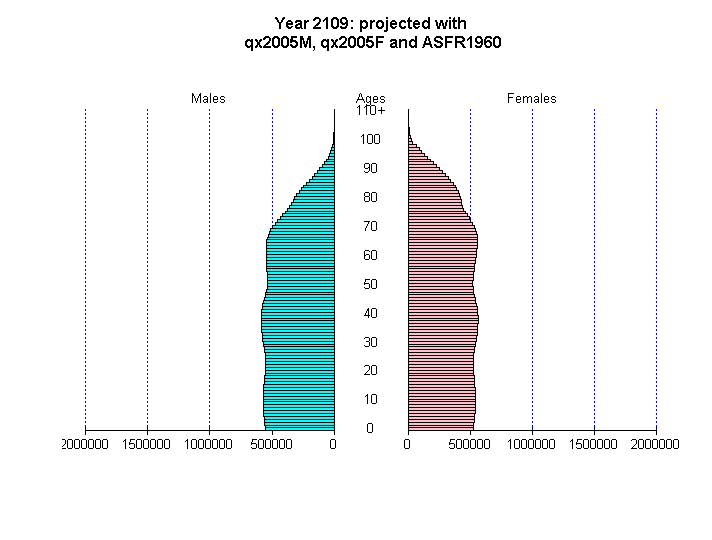
それをさらに改良して,JlifeとJfertのうち,どの年のデータを使うかをメニューから選べるようにしたコードを,menuprojection.Rに示した。pyramidパッケージとfmsbパッケージをインストールしてあれば,Rコンソールから直接,source("http://minato.sip21c.org/msb/man/menuprojection.R")により実行できる。死亡を男女とも2005年の完全生命表,出生を1960年の水準として100年間の予測を実行すると,最終画面は下図に至る。
With some improvement, I will give the code menuprojection.R, which can specify, during run, the mortality and fertility schedules from Jlife and Jfert, respectively. If you have installed the packages pyramid and fmsb, just type source("http://minato.sip21c.org/msb/man/menuprojection.R") to R console, then you can run the population projection. When I set the complete life table of 2005 for males and females as mortality and the age-specific fertility rate of 1960 as fertility, the population projection for 100 years will be done with the final graph shown below.
Statistics Bureau, Ministry of Internal Affairs and Communications: Population Census, 1888-2020.