| radarchart {fmsb} | R Documentation |
少なくとも3つ以上の変数を軸として持ち,個々の行がデータ系列を 示すようなデータフレームからレーダーチャートを描画する。
Drawing the radar chart with several lines from a data frame, which must be composed of more than 3 variables as axes and the rows indicate cases as series.
radarchart()とradarchartcirc()の違いは、前者が多角形で目盛り補助線を引くのに対して、後者が円環状に目盛り補助線を引く点だけである。
The difference between radarchart() and radarchartcirc() is type of complementary radar grid. The former draws polygon but the latter draws circle.
 radarchart(df, axistype, seg, pty, pcol, plty, plwd, pdensity, pfcol,
 cglty, cglwd, cglcol, axislabcol, title, maxmin, na.itp, centerzero,
 vlabels, vlcex, caxislabels, calcex, paxislabels, palcex, ...)

 radarchartcirc(df, axistype, seg, pty, pcol, plty, plwd, pdensity, pfcol,
 cglty, cglwd, cglcol, axislabcol, title, maxmin, na.itp, centerzero,
 vlabels, vlcex, caxislabels, calcex, paxislabels, palcex, ...)
df |
レーダーチャートを描くために使われるデータフレーム。もしmaxminがTRUEなら,各変数について,このデータフレームの最初のケース(1行目)が各軸の最大値,2つめのケース(2行目)が各軸の最小値を示し,3行目以下が実際のデータとなるように与えられなくてはいけない。変数の数は3以上でなくてはいけない。 The data frame to be used to draw radarchart. If maxmin is TRUE, this must include maximum values as row 1 and minimum values as row 2 for each variables, and actual data should be given as row 3 and lower rows. The number of columns (variables) must be more than 2. |
axistype |
中心軸と周辺軸のラベル表示方式。0~5の整数で指定。0はラベルなし,1と4は中心軸のみ,2は周辺軸のみ,3と5は両方を表示。1と3は%表示で,4と5は小数表示。デフォルトは0。 The type of axes, specified by any of 0:5. 0 means no axis label. 1 means center axis label only. 2 means around-the-chart label only. 3 means both center and around-the-chart labels. 4 and 5 are *.** format expressions of 1 and 3, respectively. (default 0). |
seg |
各軸の区切り数(デフォルトは4)。 The number of segments for each axis (default 4). |
pty |
データ点をプロットするためのシンボル記号を指定する数値。ベクトルとして与えると,行ごとに違う記号を指定することができる。行数の方が長い場合は,反復して使われる。デフォルトは16(塗りつぶし丸)である。データ点をプロットせず,線だけを描画したいときは,32を指定する A vector to specify point symbol: Default 16 (closed circle), if you don't plot data points, it should be 32. This is repeatedly used for data series. |
pcol |
データ点をプロットするためのカラーコードの数値ベクトル。デフォルトは1:8である。行数の方が長い場合は,繰り返して使われる。 A vector of color codes for plot data: Default 1:8, which are repeatedly used. |
pdensity |
多角形内部をハッチングで塗る場合のハッチングの密度を指定する。デフォルトはない(ハッチングされない)。行数の方が長い場合は,繰り返して使われる。 A vector of densities to fill polygons: Default NULL, which are repeatedly used. |
pangle |
多角形内部をハッチングで塗る場合のハッチングの角度を指定する。デフォルトは45で、45度の斜線を意味する。行数の方が長い場合は,繰り返して使われる。 A vector of angles to draw shading lines in polygons: Default 45, which are repeatedly used. |
pfcol |
多角形内部を塗る色のベクトル。デフォルトはない(塗りつぶさない)。数値でパレットコードを指定しても良いし、"black"とか"#ff0000"とか"#00ff7f7f"のような文字列でも良い。"#"に続けて16進数のRGBコードを2桁ずつ与える場合、7桁目と8桁目は透過度を示すアルファチャンネルになる。行数の方が長い場合は,繰り返して使われる。 A vector of color codes to fill polygons. It can be integer numeric palette codes, characters such as "black", or 6 or 8 digits RGB(+alpha channel) hexadecimal charactes such as "#ff0000" or "00ff7f7f": Default NA, which are repeatedly used. |
plty |
多角形枠線の線種を示す数値ベクトル。デフォルトは1:6で、行数の方が長い場合は繰り返し使われる。 A vector of line types for plot data: Default 1:6, which are repeatedly used. |
plwd |
多角形枠線の線の太さを示す数値ベクトル。デフォルトは1で、行数の方が長い場合は繰り返し使われる。 A vector of line widths for plot data: Default 1, which is repeatedly used. |
cglty |
軸の補助線グリッドの線種を示す数値。デフォルトはradarchart()では3、radarchartcirc()では1で、それぞれ点線と実線を意味する。 Line type for radar grids: Default 3 for radarchart() and 1 for radarchartcirc(), which means dotted line and solid line, respectively. |
cglwd |
軸の補助線グリッドの線の太さを示す数値。デフォルトは1で、最も細い線を意味する。 Line width for radar grids: Default 1, which means thinnest line. |
cglcol |
軸の補助線グリッドの線の色を示す数値。デフォルトは"navy"で、紺色を意味する。 Line color for radar grids: Default "navy" |
axislabcol |
軸ラベルと目盛り数値の色を示す値。デフォルトは"blue"で、青色を意味する。カラーパレットの数値指定でもRGBを示す16進文字列でも良い。 Color of axis label and numbers: Default "blue". It can be given as color palette number or characters including 6 or 8 digits hexadecimal RGB code. |
title |
もしあればタイトル文字列 if any, title should be typed. |
maxmin |
論理値。もし真ならばデータフレームは1行目に最大値、2行目に最小値を含む。偽の場合は、各軸のデータの最大値と最小値が自動的に軸補助線グリッドの最大値と最小値になる。 Logical. If true, data frame includes possible maximum values as row 1 and possible minimum values as row 2. If false, the maximum and minimum values for each axis will be calculated as actual maximum and minimum of the data. Default TRUE. |
na.itp |
論理値。真なら、NAを含むデータは補完される。偽ならNAは原点(最小値の点)にプロットされる。デフォルトは真である。 Logical. If true, data with NA are interpolated. If false, NA is placed at the origin. Default TRUE. |
centerzero |
論理値。真なら最小値はグラフの中央から始まる。偽なら最小値は各軸の中心から軸目盛り数の逆数だけ離れた位置になる。デフォルトは偽である。 Logical. If true, drawing chart with setting minimum values at the central point, otherwise there are small offsets (1/segment) for each axis. Default FALSE. |
vlabels |
周辺軸の変数名を示す文字列ベクトル。NULLならcolnames(df)によって得られる変数名がそのまま使われる。デフォルトはNULLである。 Character vector for the names for variables. If NULL, the names of the variables as colnames(df) are used. Default NULL. |
vlcex |
周辺軸の変数名フォントの拡大倍率。NULLならtext()のデフォルトの拡大率が適用される(この関数の実行前のpar(cex=)などの指定に従う)。デフォルトはNULL。 Font size magnification factor for vlabels. If NULL, default size for text() is applied (it obeys the spcification by par(cex=) etc. before execution of this function). Default NULL. |
caxislabels |
中心軸ラベルを示す文字列ベクトル。axistypeオプションでの指定を上書きする。NULLの場合、axistypeオプションで指定した文字列が使われる。デフォルトはNULLである。 Character vector for center axis labels, overwriting values specified in axistype option. If NULL, the values specified by axistype option are used. Default is NULL. |
calcex |
中心軸ラベルのフォント拡大率の数値。NULLならtext()のデフォルトの拡大率が適用される。デフォルトはNULL。 Font size magnification factor for caxislabels. If NULL, default size for text() is applied. Default NULL. |
paxislabels |
周辺軸ラベルを与える文字列ベクトル。axistypeオプションの指定を上書きする。NULLならaxistypeオプションの指定が使われる。デフォルトはNULL。 Character vector for around-the-chart (peripheral) labels, overwriting values specified in axistype option. If NULL, the values specified by axistype option are used. Default is NULL. |
palcex |
周辺軸ラベルフォント拡大率の数値。NULLならtext()のデフォルトの拡大率が適用される。デフォルトはNULL。 Font size magnification factor for paxislabels. If NULL, default size for text() is applied. Default NULL. |
... |
その他、plot.default()に与えられる引数を与えることができる。 Miscellaneous arguments to be given for plot.default(). |
No value is returned.
Minato Nakazawa minato-nakazawa@people.kobe-u.ac.jp https://minato.sip21c.org/
# Data must be given as the data frame, where the first cases show maximum.
maxmin <- data.frame(
total=c(5,1),
phys=c(15,3),
psycho=c(3,0),
social=c(5,1),
env=c(5,1))
# data for radarchart function version 1 series, minimum value must be omitted from above.
RNGkind("Mersenne-Twister")
set.seed(123)
dat <- data.frame(
total=runif(3,1,5),
phys=rnorm(3,10,2),
psycho=c(0.5,NA,3),
social=runif(3,1,5),
env=c(5,2.5,4))
dat <- rbind(maxmin,dat)
VARNAMES <- c("Total\nQOL", "Physical\naspects", "Phychological\naspects",
"Social\naspects", "Environmental\naspects")
op <- par(mar=c(1, 2, 2, 1), mfrow=c(2, 3))
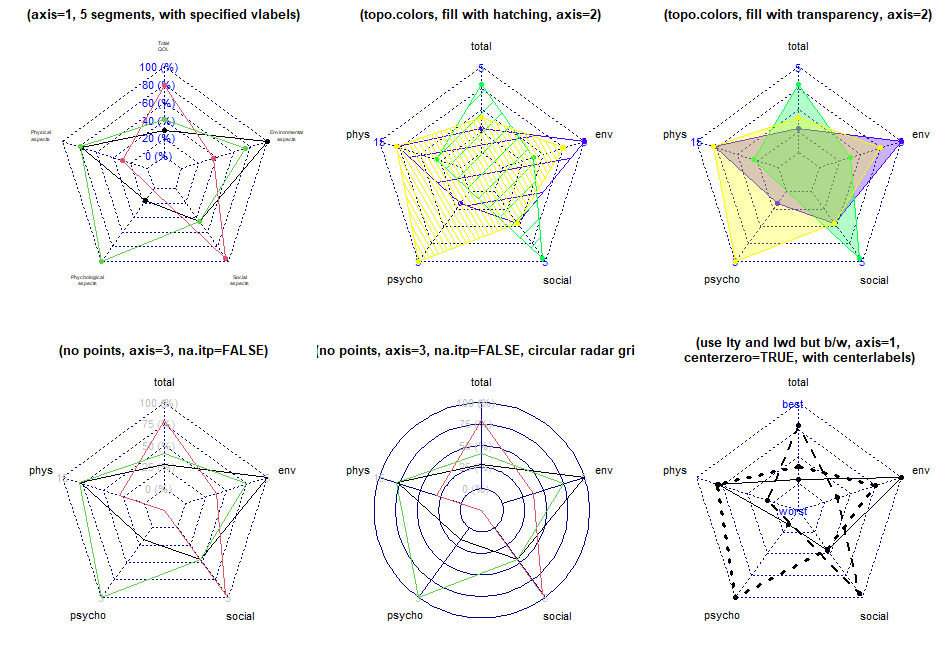
radarchart(dat, axistype=1, seg=5, plty=1, vlabels=VARNAMES,
title="(axis=1, 5 segments, with specified vlabels)", vlcex=0.5)
radarchart(dat, axistype=2, pcol=topo.colors(3), plty=1, pdensity=c(5, 10, 30),
pangle=c(10, 45, 120), pfcol=topo.colors(3),
title="(topo.colors, fill with hatching, axis=2)")
radarchart(dat, axistype=2, pcol=topo.colors(3), plty=1,
pfcol=adjustcolor(topo.colors(3), 0.3),
title="(topo.colors, fill with transparency, axis=2)")
radarchart(dat, axistype=3, pty=32, plty=1, axislabcol="grey", na.itp=FALSE,
title="(no points, axis=3, na.itp=FALSE)")
radarchartcirc(dat, axistype=3, pty=32, plty=1, axislabcol="grey", na.itp=FALSE,
title="(no points, axis=3, na.itp=FALSE, circular radar grid)")
radarchart(dat, axistype=1, plwd=1:5, pcol=1, centerzero=TRUE,
seg=4, caxislabels=c("worst", "", "", "", "best"),
title="(use lty and lwd but b/w, axis=1,\n centerzero=TRUE, with centerlabels)")
par(op)