群馬大学 | 医学部 | サイトトップ | 医学情報処理演習
医学情報処理演習:2010年度第8回課題
第8回に出てきた関数と文の主なものはこちらを参照されたい。
課題
http://phi.med.gunma-u.ac.jp/medstat/sample02.txtは,ソロモン諸島の首都のとある学校で実施した健診結果を,昨年の実習で入力してもらった後にエラーを訂正したタブ区切りテキスト形式データである。このデータを読み込んで,年齢(AGE)を横軸,収縮期血圧(SBP)を縦軸にとって散布図と50%及び95%の集中楕円を描き,ピアソンの積率相関係数を求め,相関が0と差が無いという帰無仮説の検定を有意水準5%で実行した。コードと結果と解釈を以下に示す。検定の有意水準は5%とした。
(http://phi.med.gunma-u.ac.jp/medstat/sample02.txt is the tab-delimited text file, which is the result of health check in the capital city of Solomon Islands. We have read this data to R, and draw the scattergram of AGE being horizontal axis and SBP being vertical axis, with 50% and 95% probability ellipse. Then we calculated the Pearson's product-moment correlation coefficient and tested the null-hypothesis that the Pearson's correlation coefficient is 0, with significance level being 0.05. The code and result with its interpretation are shown below.)
学籍番号・氏名とともに,下のフォームと解釈文を穴埋め[Box AとBには変数名,CとDにその次の( )内から適切な方を選択して数字で入力]して送信せよ。
(Please write the registry number and name, fill the boxes A and B by adequate variable names, and fill the boxes C and D by the number, selecting from the following candidates with parenthesis.)
コードは以下の通り。
(The code is shown below.)
x <- read.delim("http://phi.med.gunma-u.ac.jp/medstat/sample02.txt") # read data into x
require(car) # load and activate car package
dataEllipse(x$ , x$
, x$ , levels=c(0.5,0.95)) # draw scattergram with probability ellipse of 50% and 95% CI.
cor.test(x$, x$) # estimate r and test the zero-correlation
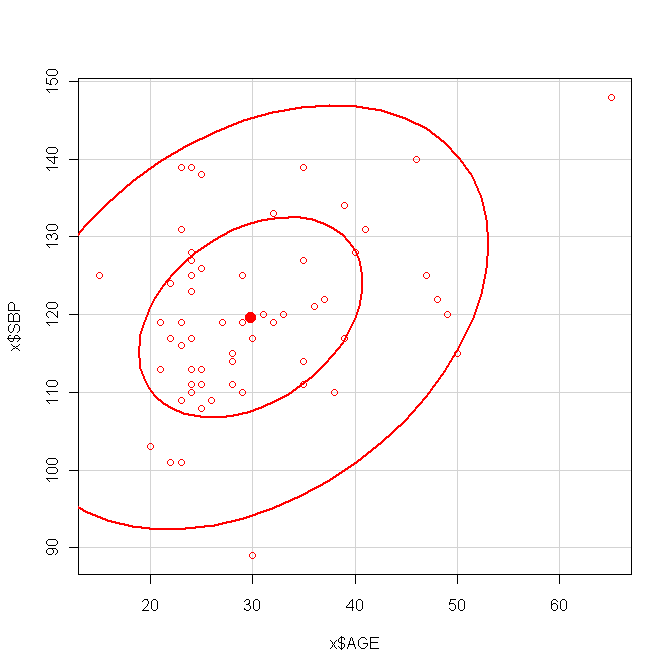
上図が描かれた後,ピアソンの相関係数が計算され,それがゼロと差が無いという帰無仮説が検定される。相関係数の点推定量は0.348で,95%信頼区間は (1: (0.105, 0.552), 2: (0.348, 0.552), 3: (0.11, 0.55))である。検定の結果,p値が約0.006と5%より小さいので,有意水準5%で統計学的に有意な相関
 (1. がある|2. はない)といえる。
(After the above graph is drawn, Pearson's correlation coefficient is calculated, then the null-hypothesis that the coefficient is not different from 0 is tested. The point estimate of the coefficient is 0.348 and the 95% confidence interval is (1: (0.105, 0.552), 2: (0.348, 0.552), 3: (0.11, 0.55)). As the result of testing the null-hypothesis that the coefficient is not different from 0, the p-value was about 0.006, which is smaller than 0.05, so that we can conclude that there (1. was | 2. was not) statistically significant correlation at 5% level.)
解答フォーム (Answer form)
リンクと引用について